Error code: STATUS_STACK_OVERFLOW when viewing Project #2082
Labels
No Label
dependencies
duplicate
help wanted
invalid
kind/bug
kind/feature
needs reproduction
question
security
wontfix
No Milestone
No Assignees
2 Participants
Notifications
Due Date
No due date set.
Dependencies
No dependencies set.
Reference: vikunja/vikunja#2082
Loading…
Reference in New Issue
No description provided.
Delete Branch "%!s(<nil>)"
Deleting a branch is permanent. Although the deleted branch may continue to exist for a short time before it actually gets removed, it CANNOT be undone in most cases. Continue?
Description
Hey there,
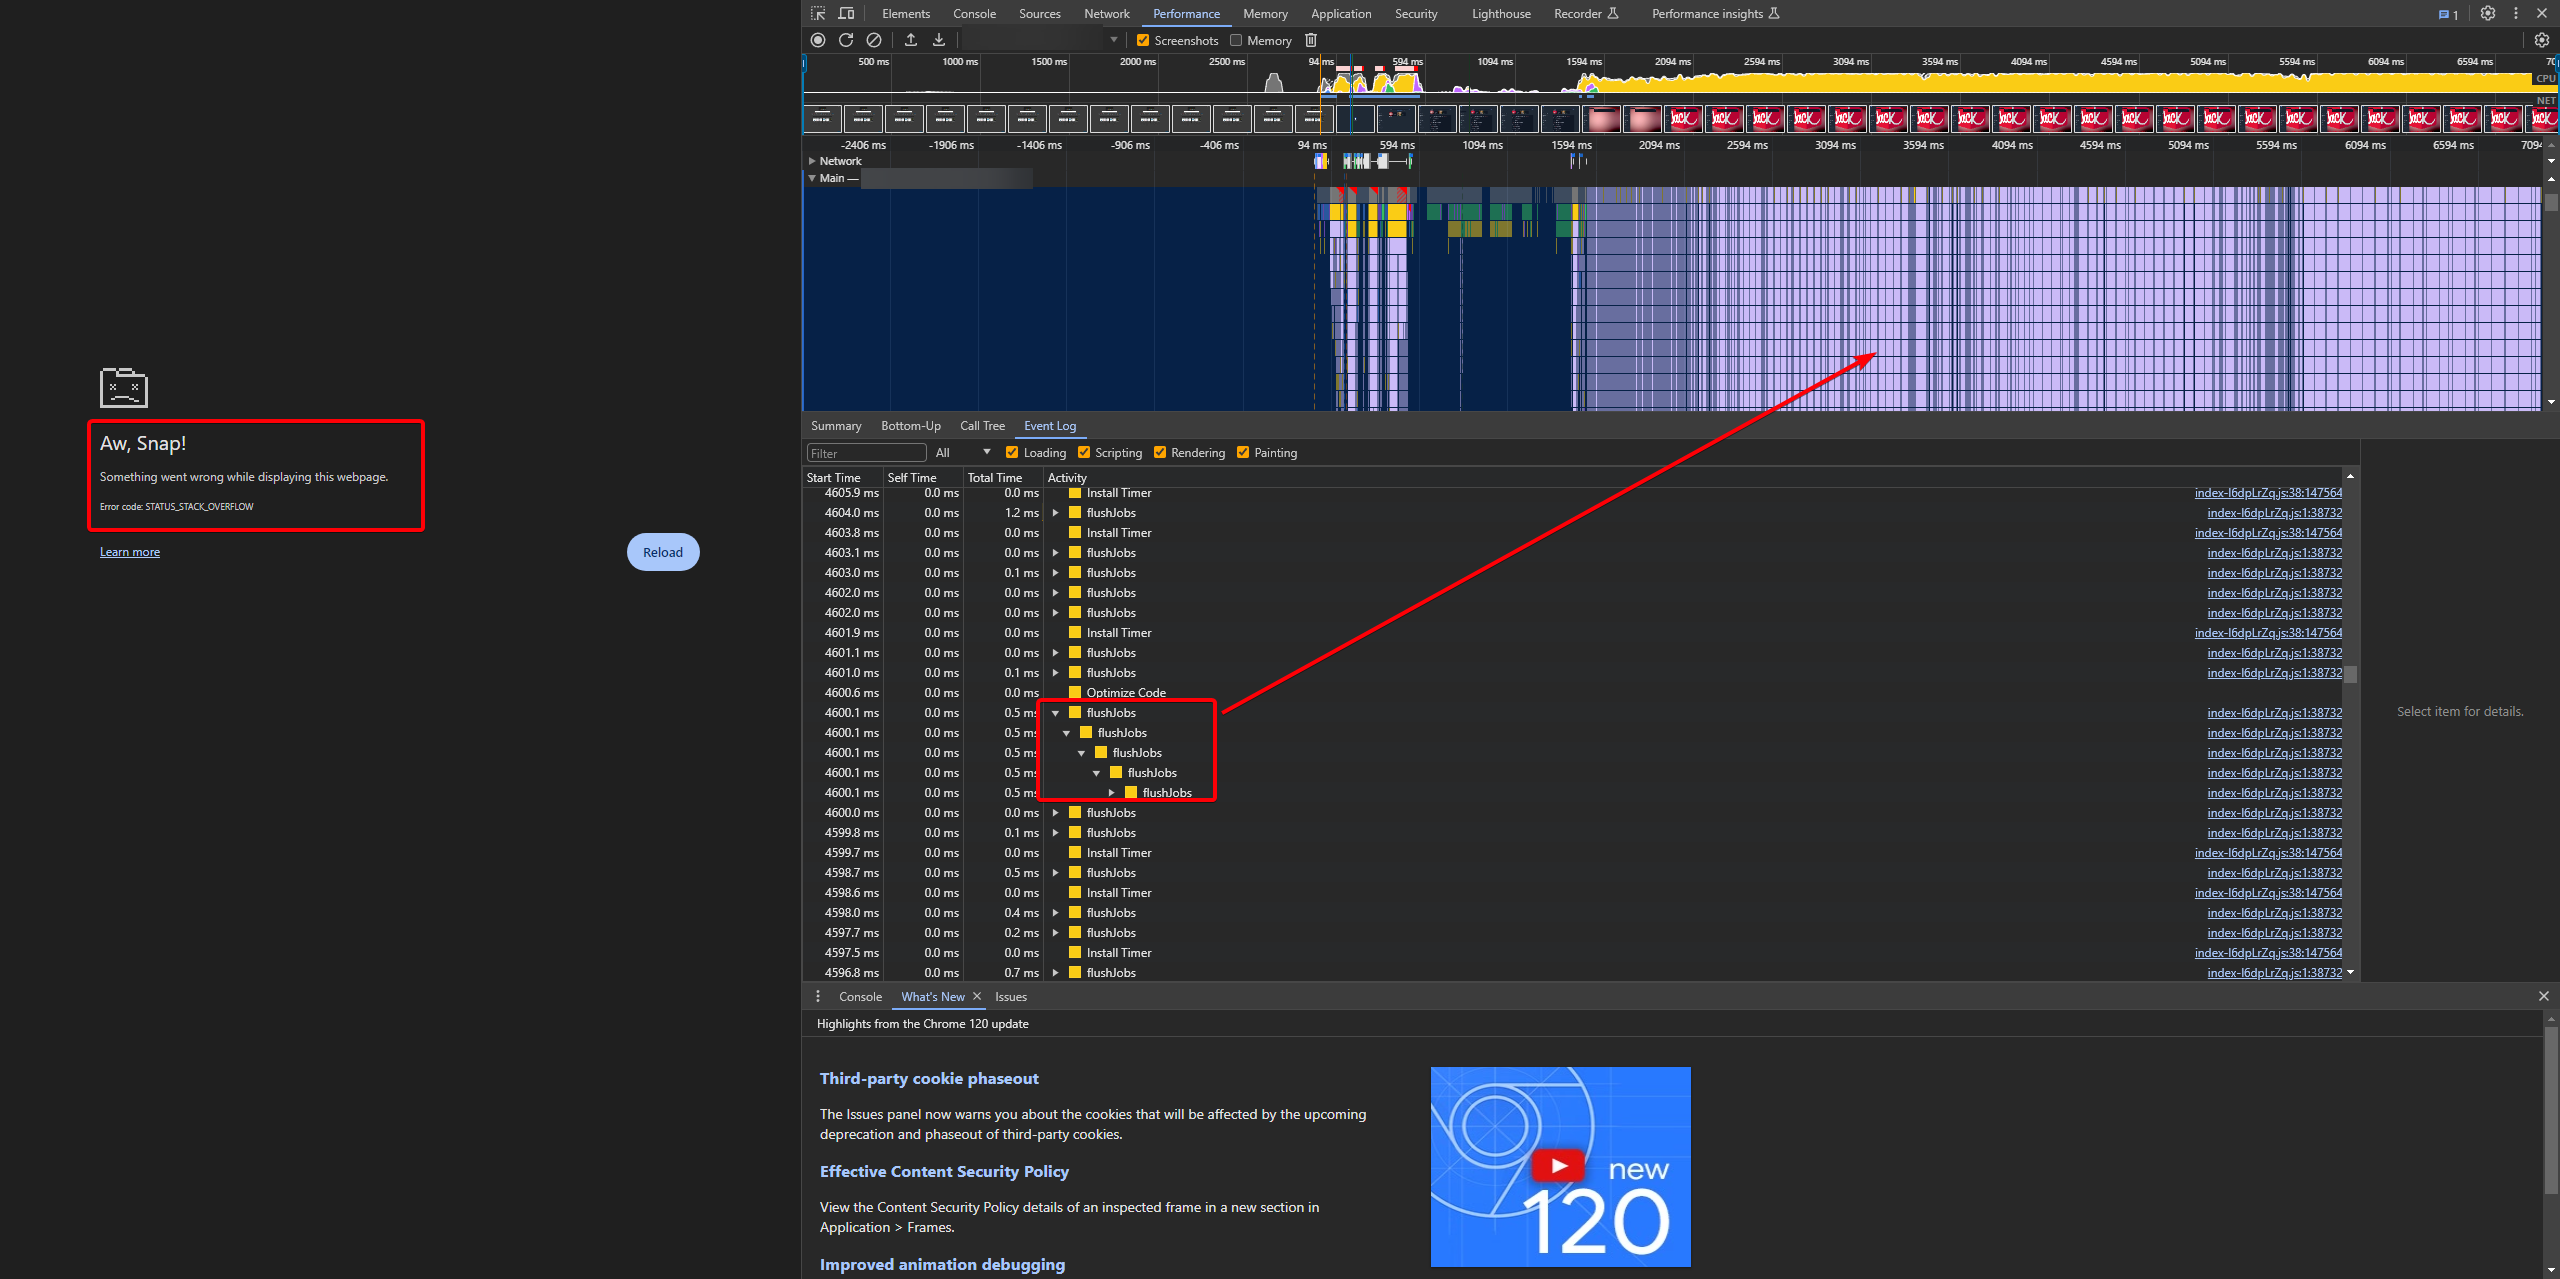
I'm getting the following error upon attempting to load a project on v0.22.0 after migrating from v0.21.0:

I wasn't really even sure where to start, so I took a crack at using Chrome's debugger:

I'm not sure if those images are really helpful. Essentially, navigating to all the other projects in the Vikunja work just fine, but upon navigating to this one - the Chrome window/tab just becomes completely unresponsive and crashes.
I am using Typesense, Redis, and Postgres. Any tips/ideas how I might debug this weird scenario? I think I'm cursed lol. The behavior is also the same if I use an Incognito window and a different machine.
Vikunja Frontend Version
0.22.0
Vikunja API Version
0.22.0
Browser and version
120.0.6099.110 (Official Build) (64-bit) (cohort: Stable)
Can you reproduce the bug on the Vikunja demo site?
No
Screenshots
No response
btw this is the Docker Compose that I've been trying to use to recreate what I think might've caused the issue (migrating), but I haven't been able to reproduce it yet. Hopefully it helps in the future?:
Does this only happen in Chrome? Anything particular for that project?
It happens on Safari on MacOS, and on iOS via the “native webapp” (I think that’s what it’s called) that Vikunja offers:

Nothing else weird that I can think of either, hmm
If you use the same background image on another project, does the same happen there as well?
Does it work on Firefox?
Same thing happens on Firefox:

When uploading the same image to another project, there doesn't seem to be any other issues...
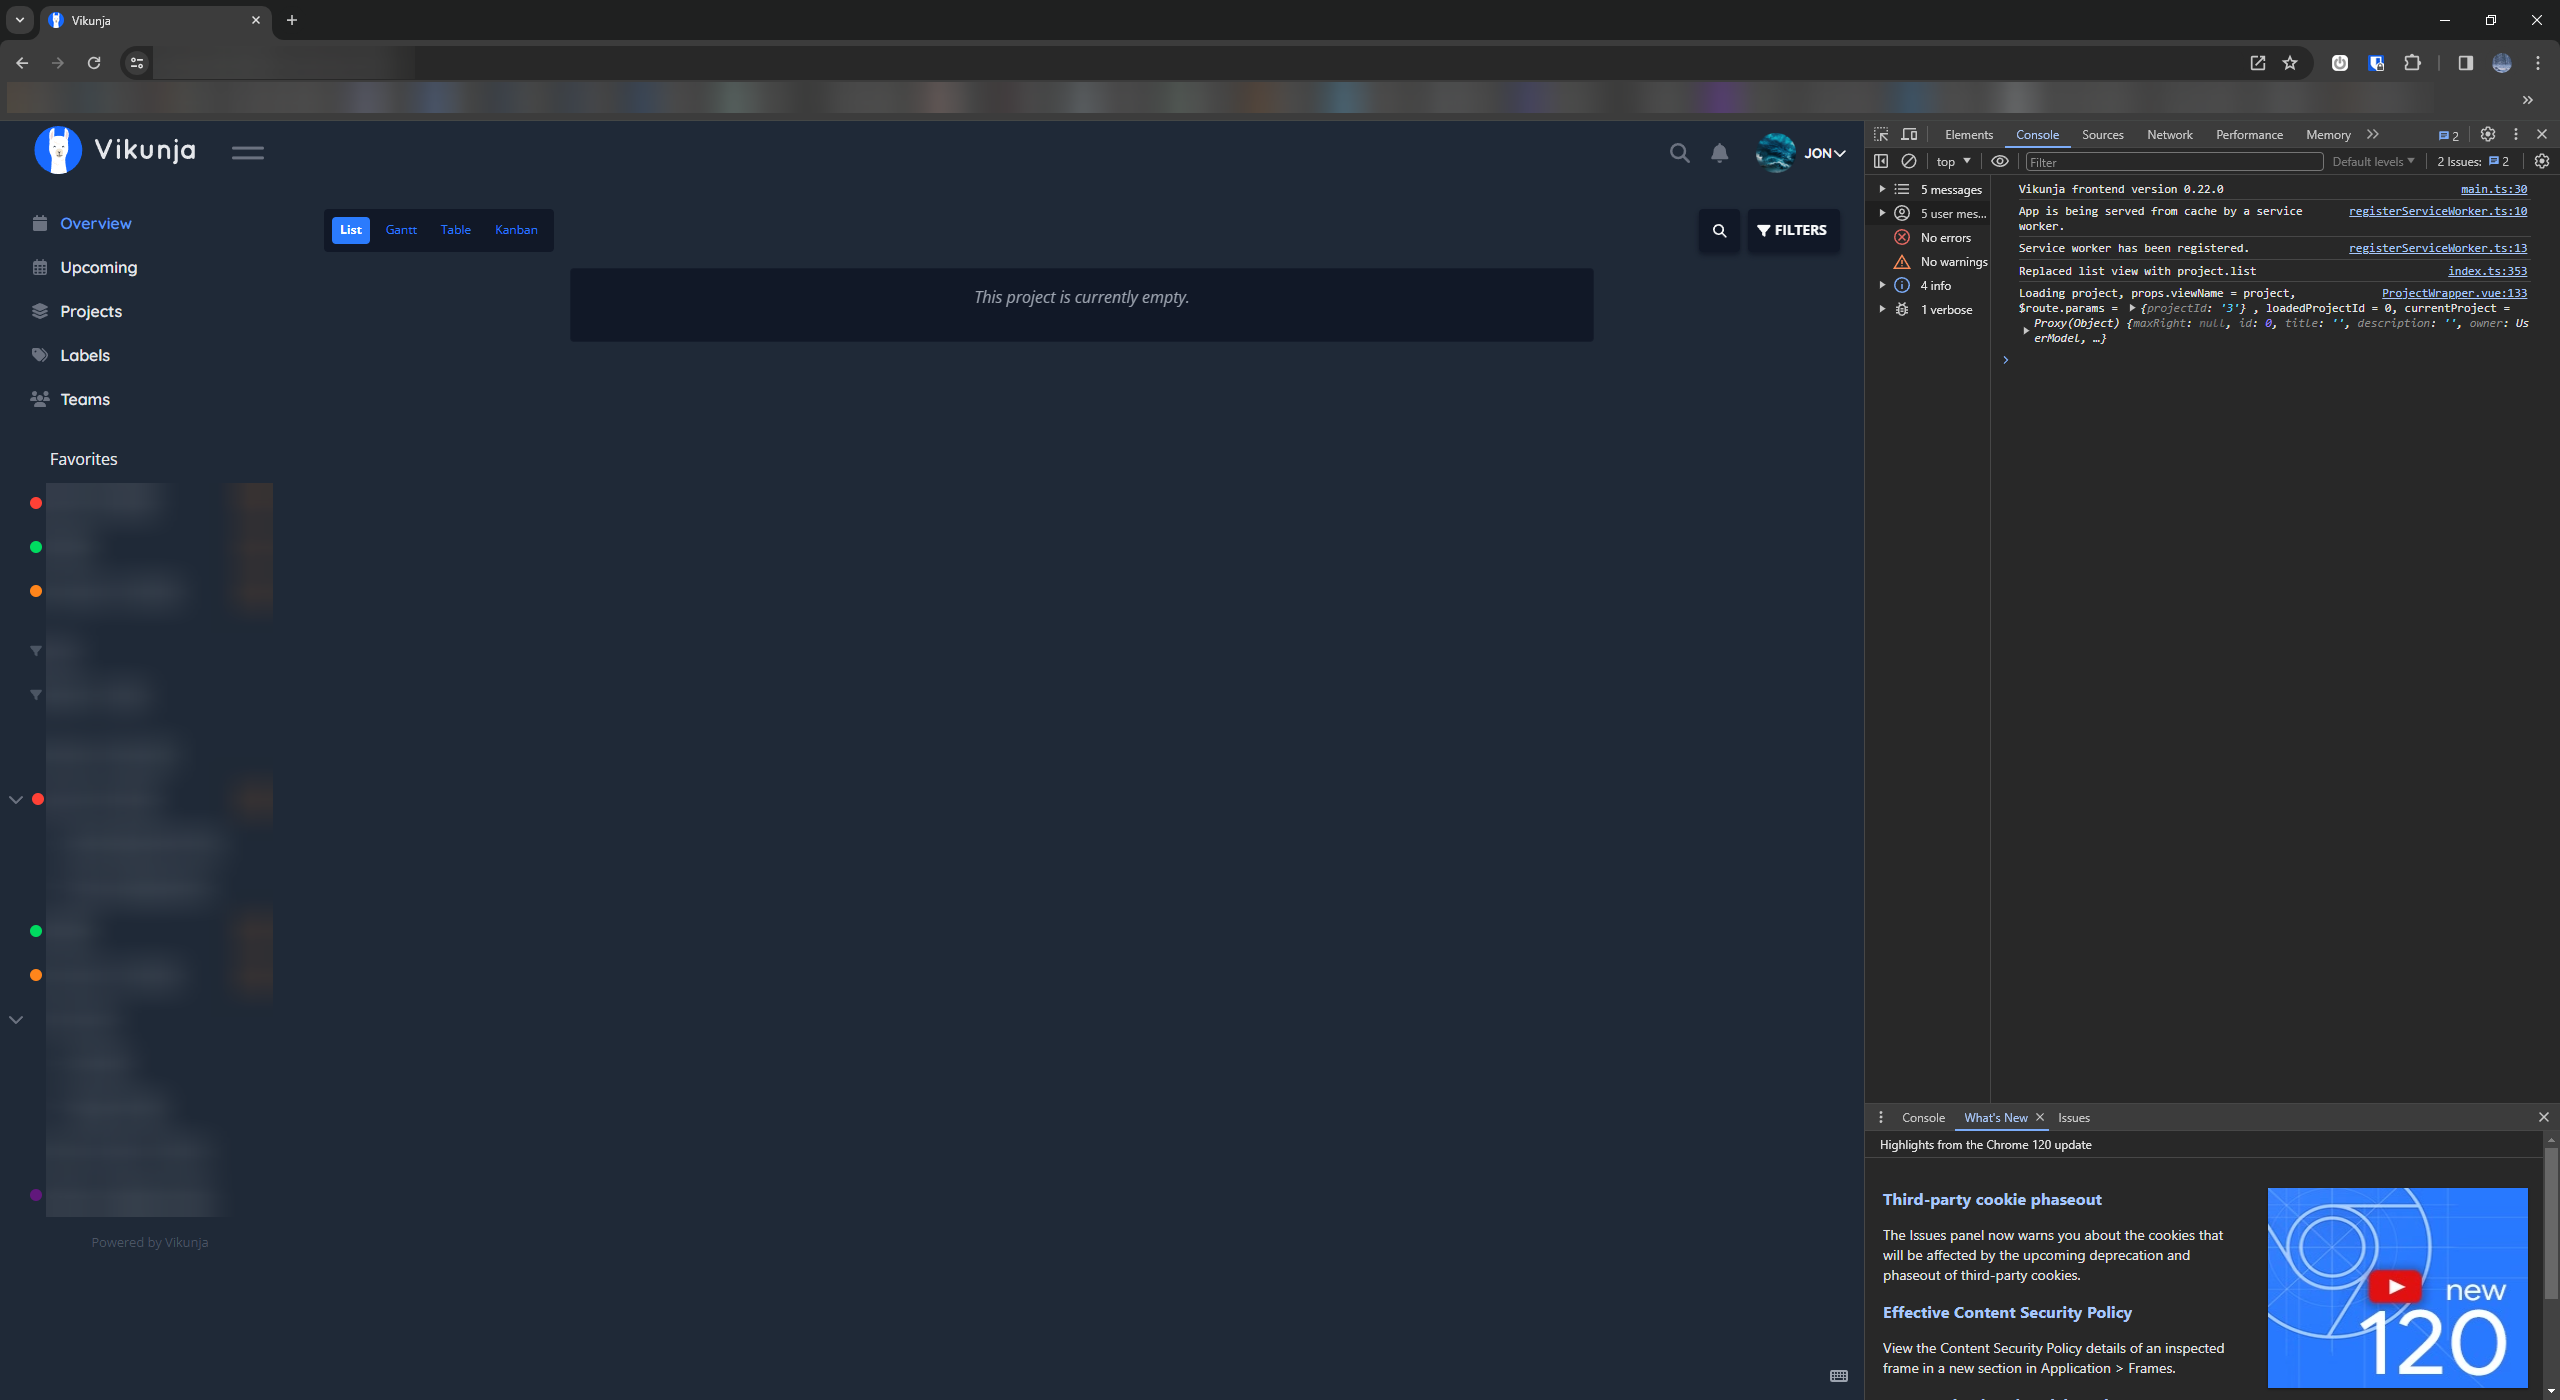
Is there anything in the browser console?
This is what shows in the browser console upon navigating to the project:

As suspected, the app crashes before it can log anything. Are you able to run a dev build (clone the frontend repo, install the dependencies and run
pnpm serve) and point it to your api? That might give more hints. I know that's not exactly easy, but I can't really reproduce it...https://kolaente.dev/vikunja/frontend#project-setup
Done, you should find the
--debugoutput attached. I navigated to the page several times, it froze, refreshed the frozen page, etc...I ran the command:
Let me know if there's some other output that you would like to see :)
As far as I can tell, nothing really stood out in the debug output.
If you open the performance tab of the devtools again, do you get a source path (same spot you marked in the screenshot)?